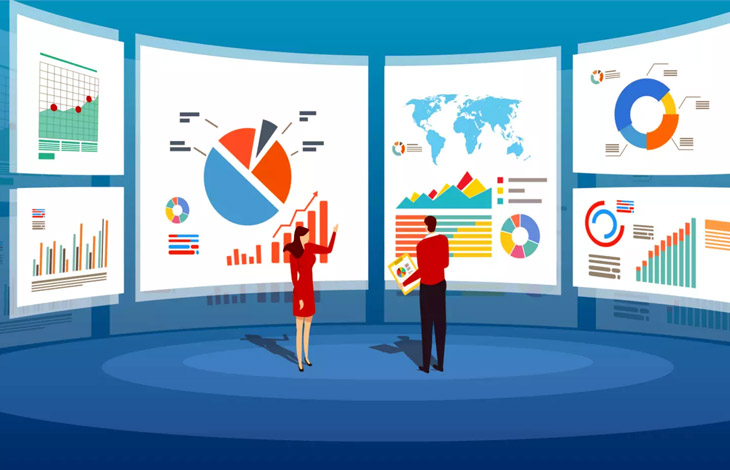
In a world flooded with data, making sense of complex information is crucial for businesses aiming to stay ahead. That’s where data visualization services come into play, revolutionizing the way we interpret and interact with data.
What is Data Visualization
Defining Data Visualization Services
Data visualization services involve the representation of data in graphical or visual formats to facilitate easier comprehension. Rather than sifting through endless rows and columns of raw data, users can grasp insights quickly through charts, graphs, and other visual elements.
Importance of Data Visualization Consulting Services
The significance of data visualization lies in its ability to simplify intricate datasets, making them accessible to a broader audience. Whether you’re a business executive or a data analyst, visualizing data enhances decision-making and drives business growth.
Benefits of Data Visualization Consulting Services
Enhanced Decision-Making
One of the primary advantages of data visualization services is their contribution to informed decision-making. Visual representations enable stakeholders to identify trends, patterns, and outliers, empowering them to make strategic choices backed by data-driven insights.
Improved Data Understanding
Humans are inherently visual creatures. Data visualization taps into this inclination, translating data into visuals that are easier to understand. This not only accelerates comprehension but also minimizes the risk of misinterpretation.
Increased Engagement
Presenting data visually captures the audience’s attention more effectively than raw data. Whether in a boardroom presentation or a client meeting, engaging visuals can communicate complex ideas with simplicity, fostering better understanding and engagement.

Types of Data Visualization Services
Charts and Graphs
Charts and graphs, such as bar charts, pie charts, and line graphs, are fundamental tools in data visualization. They help illustrate relationships, trends, and proportions within datasets.
Dashboards
Dashboards provide a comprehensive view of multiple metrics in one centralized location. Businesses often use dashboards to monitor key performance indicators (KPIs) and track progress toward goals.
Interactive Reports
Interactive reports allow users to manipulate data visuals, offering a hands-on experience. This level of interactivity enhances user engagement and facilitates a deeper exploration of data.
Key Features to Look for in Data Visualization Tools
User-Friendly Interface
opt for data visualization tools with intuitive interfaces, ensuring that users, regardless of their technical expertise, can navigate and utilize the platform effectively.
Customization Options
The ability to customize visualizations to align with specific business needs is crucial. Look for tools that offer flexibility in design and layout.
Integration Capabilities
Seamless integration with existing software and data sources ensures a smooth workflow. Consider tools that can integrate with your current tech stack.

Challenges in Data Visualization
Data Security Concerns
While data visualization enhances accessibility, ensuring the security of sensitive information remains a priority. Put strong security measures in place to stave off unwanted access.
Learning Curve
Using new technologies frequently involves a learning curve.Companies should invest in training programs to familiarize teams with the features and functionalities of data visualization tools.
Compatibility Issues
Ensuring compatibility with existing systems and datasets is essential. Compatibility issues can hinder the seamless integration of data visualization services into your workflow.
Trends in Data Visualization Services
Augmented Reality (AR) Integration
The integration of augmented reality enhances the immersive experience of data visualization, allowing users to interact with data in three-dimensional spaces.
Predictive Analytics
Predictive analytics within data visualization tools enable businesses to anticipate future trends and make proactive decisions based on forecasted insights.
Storytelling with Data
Data storytelling transforms raw data into compelling narratives, making it easier for stakeholders to grasp the significance of the information presented.
How to Choose the Right Data Visualization Service for Your Business
Assessing Business Needs
Begin by understanding your business’s specific data visualization requirements. Identify the key metrics and insights crucial for your decision-making processes.
Scalability and Flexibility
Choose a data visualization service that can scale with your business. Flexibility in adapting to changing needs ensures long-term usability.
Cost Considerations
Evaluate the cost of implementing and maintaining data visualization services. While investing in quality tools is essential, ensure they align with your budgetary constraints.
Future of Data Visualization
Emerging Technologies
Keep an eye on emerging technologies such as artificial intelligence and machine learning, which are poised to revolutionize data visualization capabilities.
Evolving Industry Landscape
As industries evolve, so do the demands on data visualization services. Stay abreast of industry trends to ensure your chosen tools remain relevant and effective.
Final Thoughts
data visualization services have become indispensable tools for businesses navigating the complexities of the modern data landscape. By transforming intricate datasets into clear and actionable insights, these services empower organizations to make informed decisions and drive success.
FAQs
What is the primary purpose of data visualization services?
Data visualization services aim to represent complex datasets visually, enhancing understanding and facilitating informed decision-making.
How can data visualization benefit small businesses?
Small businesses can leverage data visualization to quickly comprehend data, identify trends, and make strategic decisions without the need for extensive analytical expertise.
Are there free data visualization tools available?
Yes, many free data visualization tools offer basic features. However, businesses with specific needs may opt for premium solutions with advanced functionalities.
What challenges do businesses commonly face when implementing data visualization?
Common challenges include data security concerns, the learning curve associated with new tools, and compatibility issues with existing systems.
Can data visualization consulting services handle big data?
Yes, many data visualization services are equipped to handle large datasets, providing insights into trends and patterns within big data.


